
The following is the text of a ‘provocation’ I gave at the Responsible, Ethics-Aware Research and Innovation in Data Science symposium hosted by the Alan Turing Institute in March 2016. For the event, my colleague Stefan Kueppers and Professor George Roussos at Birkbeck University of London generated a new set of Lifecharm shells using data from a research trial with sufferers of Parkinsons Disease. We 3D printed multiple copies of 4 shells which were given to the participants as a tangible souvenir of the data manifestation concept.
**********


I’m going to speak today about a concept I call “data manifestation” and how I believe it can add a significant dimension to data science and how we make meaning from data.
First I wish to pose a question –
How do we know what we know?
And how do we make meaning from what we know?
The answer is, of course, through the interaction of our senses with the stimuli coming in to them from the external world – and how this is processed by our consciousness and woven in together with our memories and emotions.
This is a system of high complexity and entanglement. It produces judgements based on multiple factors and dimensions all working together.
I believe that this is qualitatively different to the kinds of inference driven systems that are increasingly coming to dominate our civilisation and how it operates.
For instance: when we feel that something we have eaten is delicious, how do we know this?
It is not just the taste that defines this judgement, but includes many other factors such as smell, look, texture, sound, shape and size, whether it invokes memories, or causes a momentary shift in our sense of balance. If each of these factors is seen as a data input, how would we begin to map such complexity into the decision-making systems of today?
Art and aesthetics are another example of this complexity. When you encounter a work of art the experience itself which determines your aesthetic reaction to the piece – whether one of awe, delight, revulsion or indifference – is driven by similar complex factors. The use of materials, colour, scale, lighting, etc as well as memory and emotion create each person’s own aesthetic experience. There can be no right or wrong aesthetic experience, only how each individual experiences a work of art in relation to the summation of their own existence.
Much of the data that is captured, recorded, analysed and used as the basis of inferential decision making systems in the everyday world is principally derived from visual interfaces, from the writing of the software that generates it to the representation of the data in screen-based visualisations – from spreadsheets, to graphs and animations. There are in a few cases some sonic representations of data, and in extremely rare cases some haptic interfaces. But on the whole the way we create, analyse and present data is visual and screen-based.
But not all experiences are visual. And my proposition is that by failing to encompass the whole and extraordinary sensitivity and careful tuning of the human sensorium in our methods of expressing data we are missing huge potential.
Back in 2012 Proboscis was commissioned to collaborate with scientists at Philips Research Lab in Cambridge as part of a public art programme. We were asked to explore the problem posed by the failure of commercial biosensor devices to engage people in leading more healthy lifestyles. Essentially the FitBits, Fuelbands and similar devices were being switched off within a few weeks of activation. Philips is a big player in the separate business of TeleHealth (where people with serious medical conditions have instrumented homes that record and transmit data to health professionals and back to the users). They were interested in how these emerging life-tracker devices could have positive well-being and health benefits for nominally healthy people over the long term. But the usage data suggested this was simply not happening.
Looking at the problem, our insight as artists was that this was an issue of relevance to people’s sense of their own self, to their identity. Our hunch was that the ways in which the narrative of a person’s life helps construct their sense of self were just not being engaged by the graphs of data represented on smartphone screens or laptops. Humans frequently invest meaning in objects that act as triggers for memory and personal significance. These can be highly ritualised objects such as wedding rings or other kinds of jewellery. They can also be seemingly random objects, such as a piece of cloth or a pebble from a beach. With all these things, the memory is evoked not just by the sight of the object, but through other factors such as the way it feels.
Our insight was to connect this tactile relationship to meaning with the kinds of data that could be collected by tracking devices. We built a simple data logger with off the shelf components and collected a range of data over a week from members of our studio: step count; pulse rate, sleep patterns, blood pressure, stress factors etc.
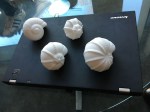
My colleague Stefan Kueppers then developed an algorithm based process to flow this data into a shape that could be 3D printed. We looked to nature for inspiration and realised that the mathematics and geometries in shells would allow for extraordinarily complex and unique expressions of data in a 3 dimensional form. Here are a few examples of the objects we made from our own biodata. We called these “Lifecharms” and the project, “Lifestreams”.
What I am going to show you next is our latest experiment. We have been collaborating with Professor George Roussos at Birkbeck (where Stefan is currently working on his PhD about the Lifestreams work) to adapt and extend the data manifestation concept to other uses.
Birkbeck have been running a data collection project working with Parkinson’s Disease patients – mapping the wide variation of symptoms that they experience. Parkinsons is a disease encompassing high variability in symptoms between individuals; ideally this ought to imply a high degree of personalisation in their medical care and disease management regimes. Yet health policy and medical care management for Parkinson’s sufferers are determined by a ‘scale’ (called the UPDRS) derived from about 70 factors of motor performance criteria a Parkinsons patient is classified against. These factors are collapsed into a single “summary statistic”, which is then used to assign treatment for patients according to where they lie on the scale. Whilst this is an effective way to communicate the multiple dimensions of Parkinson’s on a linear scale of progression, because of the enormous variation it is common for people with entirely different symptoms to score similarly on the scale, yet require very different care.
For patients and health professionals alike, finding ways to express the unique characteristics of an individual’s actual experience of Parkinson’s would be a big step both for personal dignity and as a way to convey the wide variations in an easily appreciable manner to policymakers.
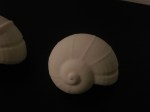
What you see in these four examples here, a version of which you are being given to take away and keep, is an expression of three data sources from four individuals who participated in the Parkinson’s trial, each mapped in 3 dimensions into the form of a shell. They demonstrate the clear variations in symptoms experienced by these individuals. The data used were :
1) Tremor in the Left Hand – which maps to how much the spiral of the shell stretches outwards.
2) Left Leg Agility – which maps to the overall growth scale of the shell (i.e. how big it gets in terms of volume)
3) Two Target Fingertapping (Left Hand) – which maps to the change in the frequency of the recurring ridges on the exterior of the shell.
These four shells are only a very initial experiment and there are many more factors that we will be able to control with data sources from the trial in future iterations, such as the number and increment of rotations, ripples in the curve of the shell exterior, the sweep curve of the main shell, twists in the shell curve, other geometric entities occuring on the shell surface (spines and nodules) as well as the number of segments that make up the whole shell.
A key indicator in Parkinsons is how it affects a person’s left and right sides of their body so, in the future, we also propose to develop twin or “clamshell” forms that spiral out from a common centre and reflect differences recorded between a person’s left and right symmetries.
As you can see, and soon feel, even with just 3 data sources informing the shell growth parameters, it is possible to appreciate the individuality of each person in a way that is qualitatively different to looking at a graph. As we introduce more granularity and complexity, the individuation will become even more pronounced.
Taken as snapshots, such shells, could over time reflect the changes in Parkinson’s symptoms as experienced by sufferers.
What use is this? We believe that this kind of approach offers a very different and rich way to express complex datasets for making meaning in a world where data is ubiquitous, is increasing exponentially and – as we are constantly being told – is overwhelming us.
My proposition is that in this way we can find alternative ways to make meaning and take decisions based on human insight and judgement from complex data sets. We don’t just have to simplify and summarise data in linear ways to make it easier to represent visually on a screen, we can also use our other senses – touch, sense of scale and balance, taste, smell, hearing, time and temperature. We can also benefit from other knowledge traditions (as well as contemporary science) and apply methodologies and critical analysis from the arts and humanities, such as aesthetics, to make meaning and draw judgements from highly detailed material artefacts that reify complex data sets into actual things, not just representations on a screen.
Thank you.
Characteristics of the Shells
Shell 1 – spiral not so pronounced, which indicates that the left hand tremor amplitude is not so strong; the shell size is quite big indicating the patient has significant increase in amplitude of left leg tremor; the ridges are also become quite pronounced indicating that there is a growng lack of accuracy and slowness in finger tapping.
Shell 2 – the spiral is at the higher end, suggesting the patient has a higher amplitude of left hand tremor; the shell size is a bit smaller so the patient experiences less left leg tremor amplitude; the ridges are very small indicating a higher degree of accuracy and speed in the patient’s finger tapping.
Shell 3 – the spiral is a median, indicating a moderate but not pronounced amplitude of left hand tremor; the shell size is slighty above average, suggesting increasing tremor in the left leg; and the ridges are fairly pronounced suggesting a greater lack of accuracy and slowness in finger tapping.
Shell 4 – very pronounced spiral suggesting very high amplitude of left hand tremor; shell size is smaller indicating less amplitude of left leg tremor; the ridges are very pronounced suggesting a high lack of accuracy and slowness in finger tapping.

You must be logged in to post a comment.