 This post draws together some of the many strands that have led to a new project – “Materialising Data, Embodying Climate Change” – which I have just begun with Tom Corby at Central Saint Martin’s, University of the Arts London. I want to make links across what may often seem like a wildly divergent practice – from collaborating with people in the jungle of Papua New Guinea, to working on tech ethics and policy interventions, to building experimental communications platforms, to making abstract sculptures from data, to facilitating workshops in languages I don’t speak with people who have experienced trauma I can barely comprehend.
For me there is a clear trajectory and purpose, which centres on inspiring agency in others. I believe that the answers we need to address our problems – as individuals, as communities, as peoples, as a species – are all around us, hiding in plain sight. The greatest asset we have, as human beings, is our imagination – with it we can devise solutions to whatever we encounter that holds us back, or create new problems for ourselves. Everyone is born with it, and its abundance is the true wealth of our societies and cultures. But while we have a terrible penchant for externalising imagination and corralling it in things – principally valued as commodities – yet it is ever at hand when we need it in challenging circumstances or crises.
Right now we face the implications of our species’ failure to act for a generation in the face of mounting evidence that unconstrained climate change is inevitable and will bring unfathomable disruption to all life on earth. It falls to our imaginations to grapple with these issues – to imagine different paths, to free ourselves from the restraints that have privileged some people’s imaginations and abilities as being more worthwhile or valuable than those of others. I hope with this new project not just to inform, but to inspire people to act.
Materialising Data, Embodying Climate Change is a major three year research project funded by the AHRC which will build on the legacy of the Lifestreams project which I led back in 2012 (with Stefan Kueppers), my 2014 Creativeworks Entrepreneur-in-Residence award with George Roussos at Birkbeck University of London and the experiments with data manifestation and Parkinson’s Disease which Stefan, George and I did in 2016. It also draws heavily on Tom’s long collaboration with Gavin Baily and the British Antarctic Survey creating artworks with climate data, such as Southern Ocean Studies and Northern Polar Studies. It has been a long haul to get here – I first began exploring ideas with Tom in early 2016 around our shared desire to explore how we could engage people with the complex data being generated by multiple interacting climate phenomena (e.g. sea temperature; sea salinity; polar ice extents; methane and other gas levels; krill population etc). For more than a generation, mainstream media coverage of climate change issues have rarely strayed from focusing on just a single issue – such as the ozone layer, and then CO2 levels – yet it is now clear that it is the interaction of multiple climate phenomena that are driving the changes we seek to control.
I have also had years of discussions with my friend Juan Francisco Salazar at Western Sydney University about how the Lifestreams process could engage with data about the Antarctic. Juan is a filmmaker and anthropologist who has made several trips to the Chilean Antarctic base, and made a feature-length documentary, Nightfall on Gaia, there in 2015. Our discussions have often revolved around how to make the changes that are directly perceptible in more remote and fragile ecological sites, such as Antarctica, accessible in a tangible and tactile way to people living in the urban industrial world, where experiences of the natural world have been muted by human intervention and our connection to nature is fundamentally disrupted. Juan also leads on the Antarctic Cities project, an inspiring collaboration of Australian, New Zealand and Chilean institutions linking three cities (Hobart, Christchurch and Punta Arenas) with each other and Antartica.
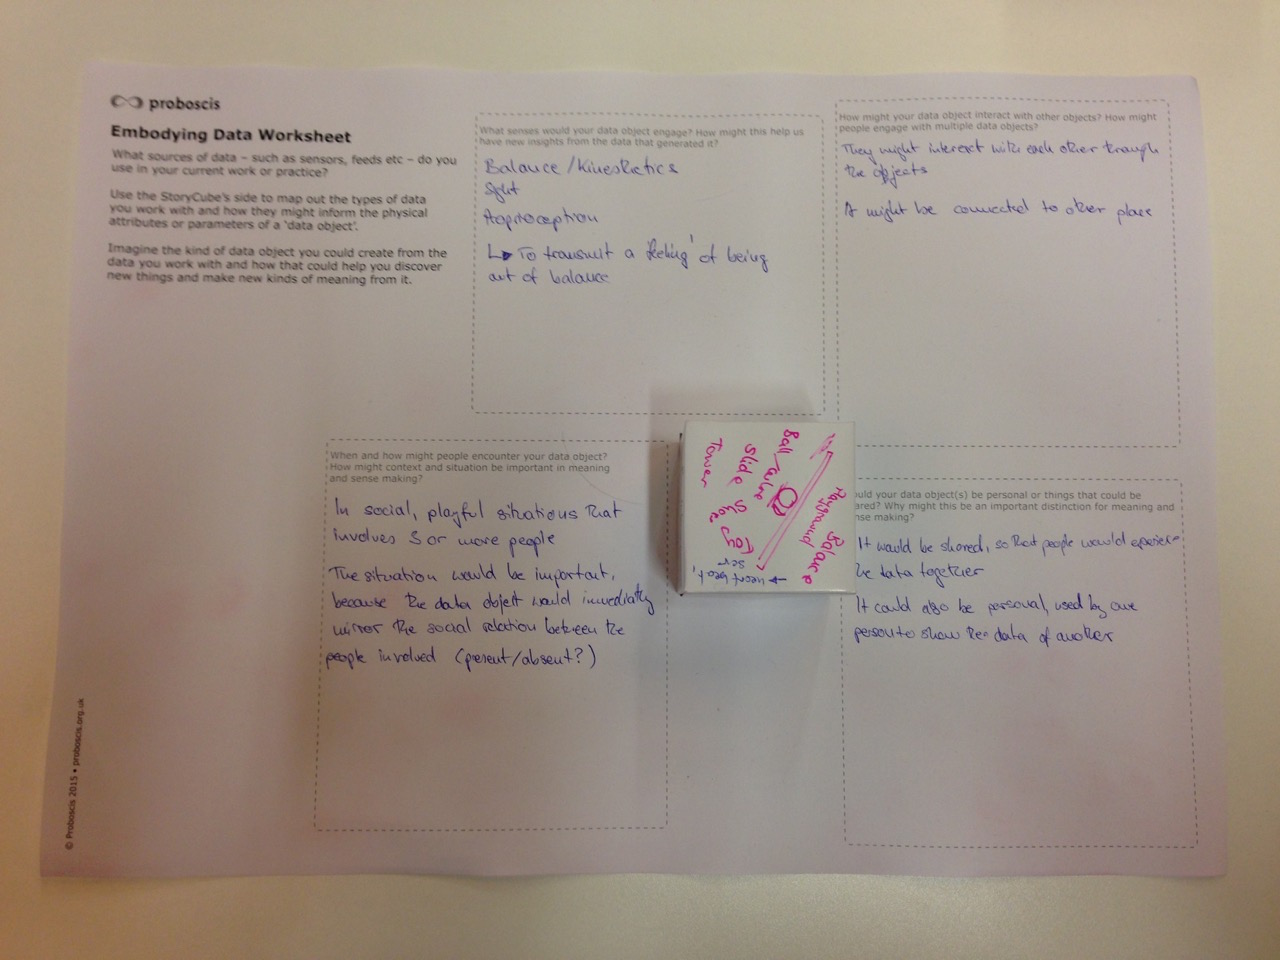
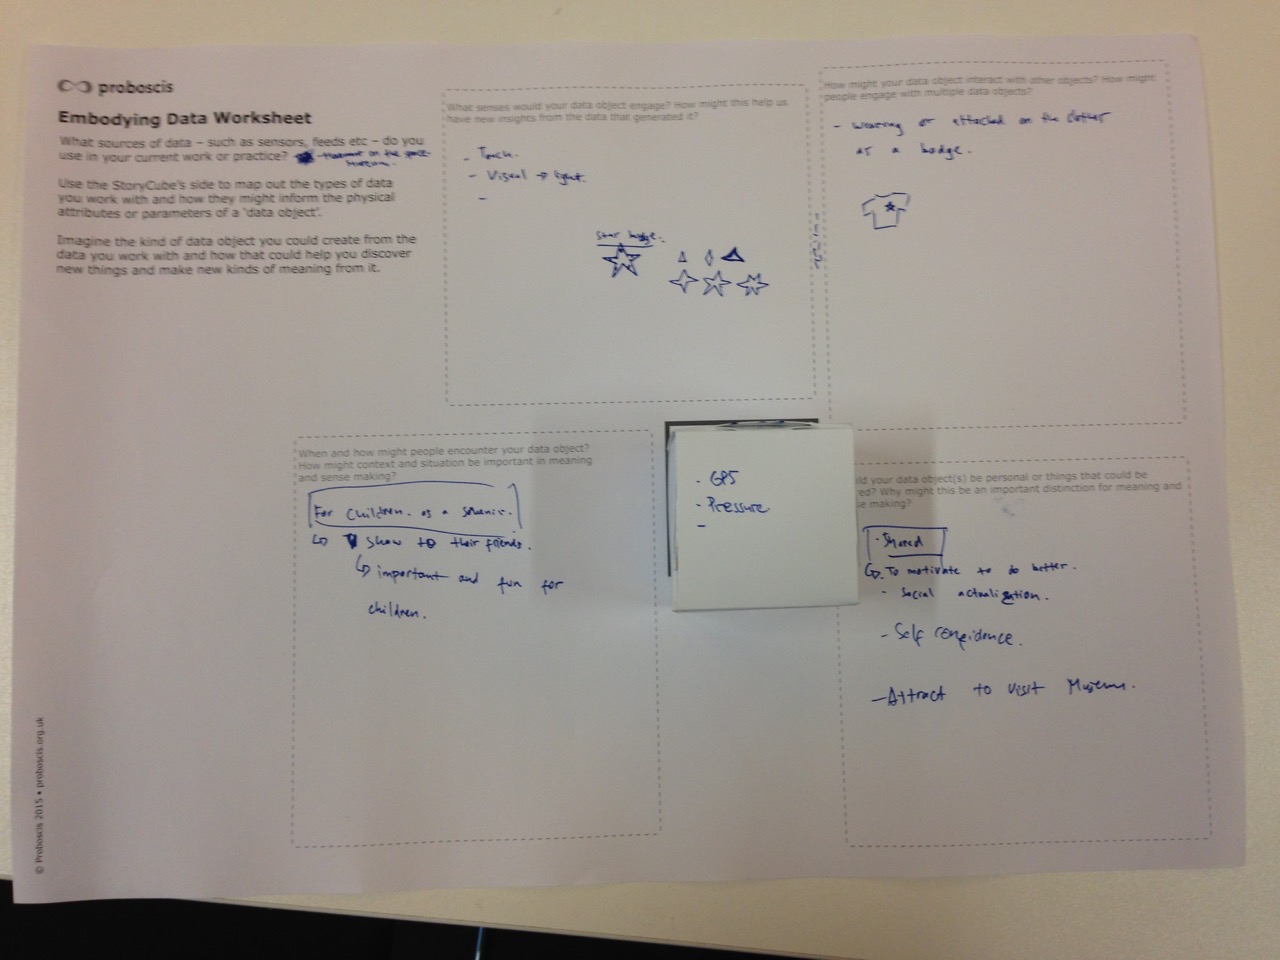
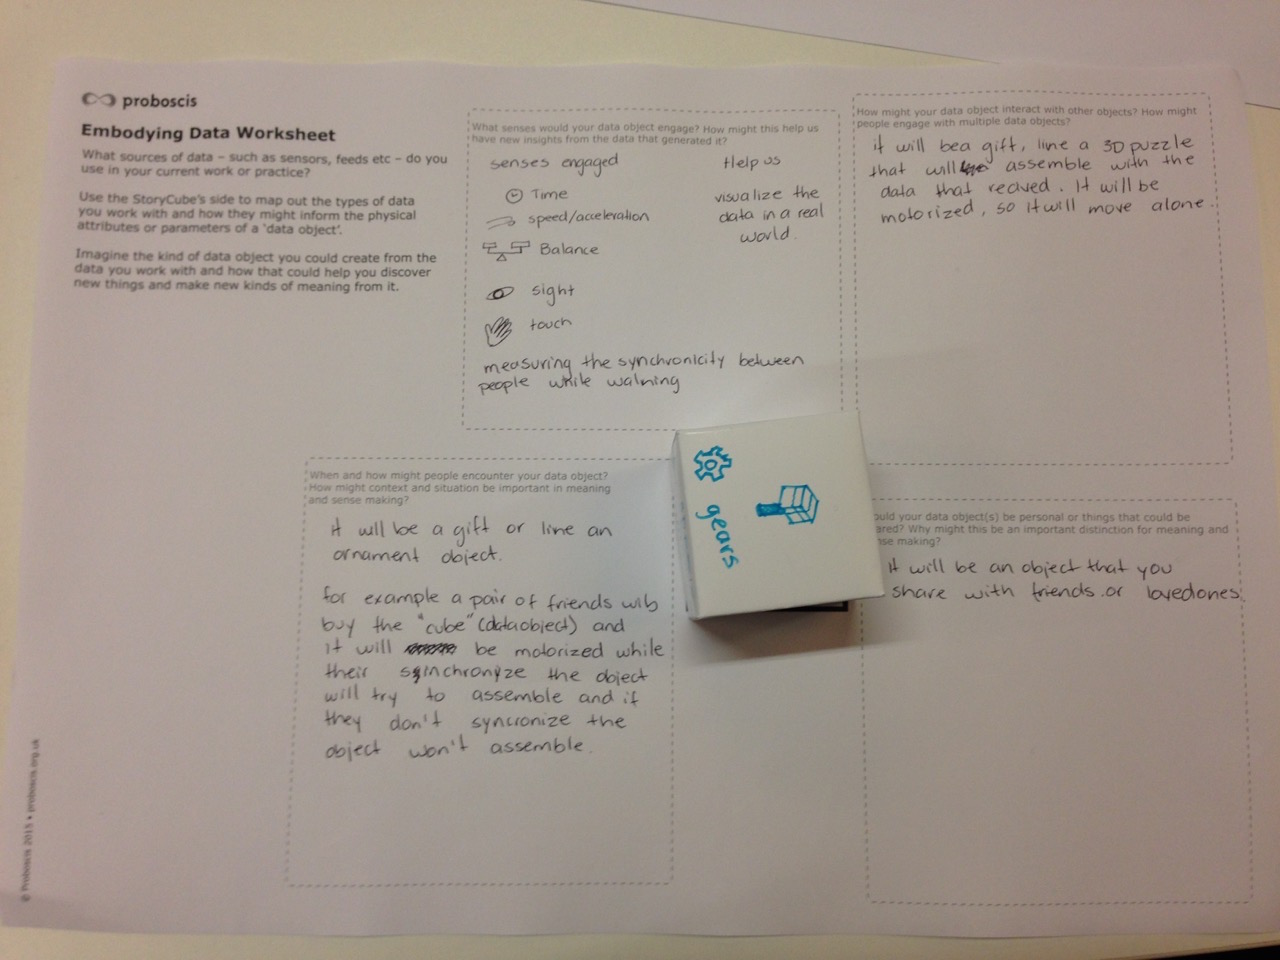
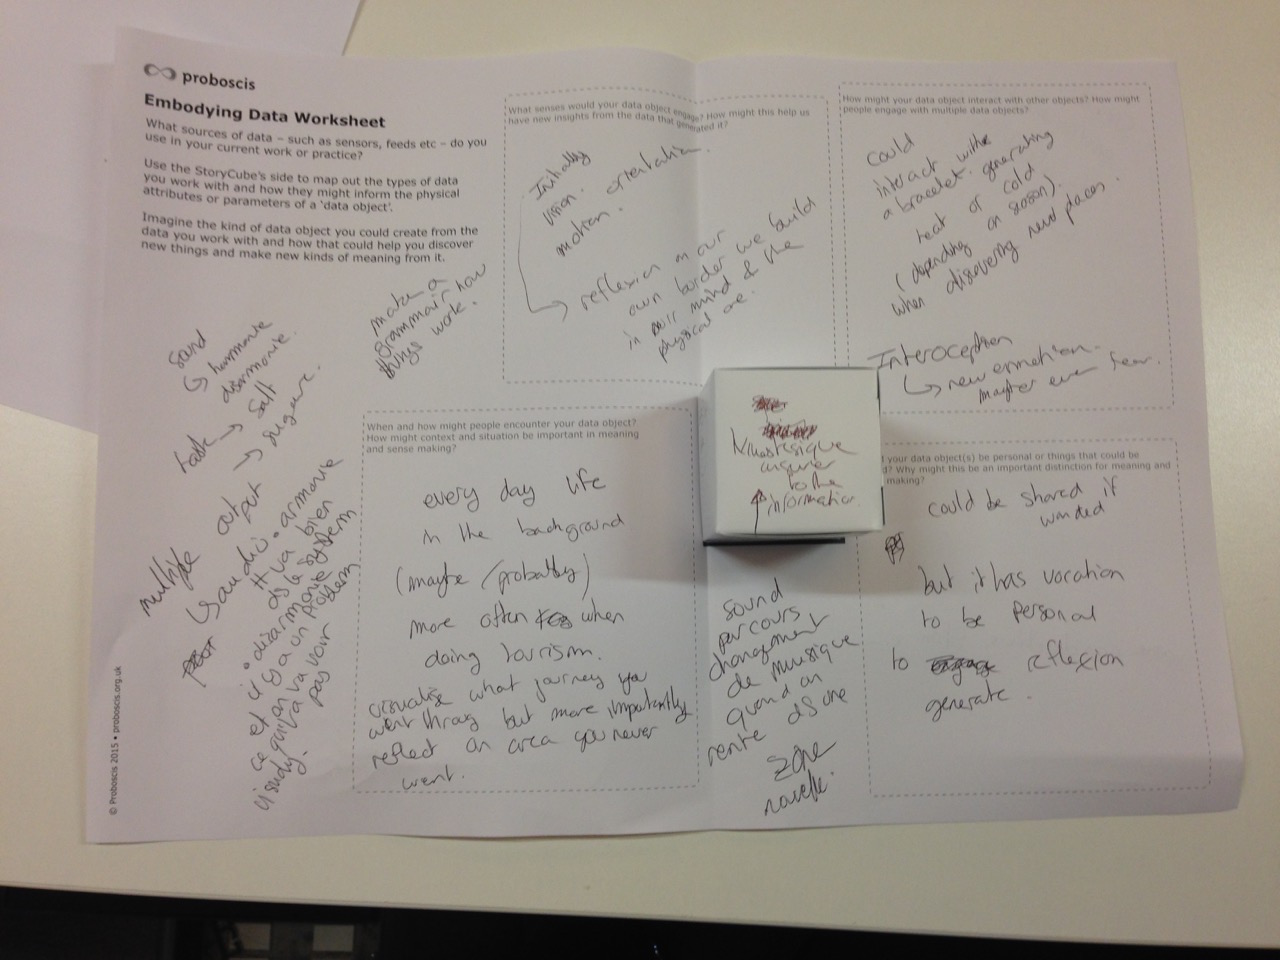
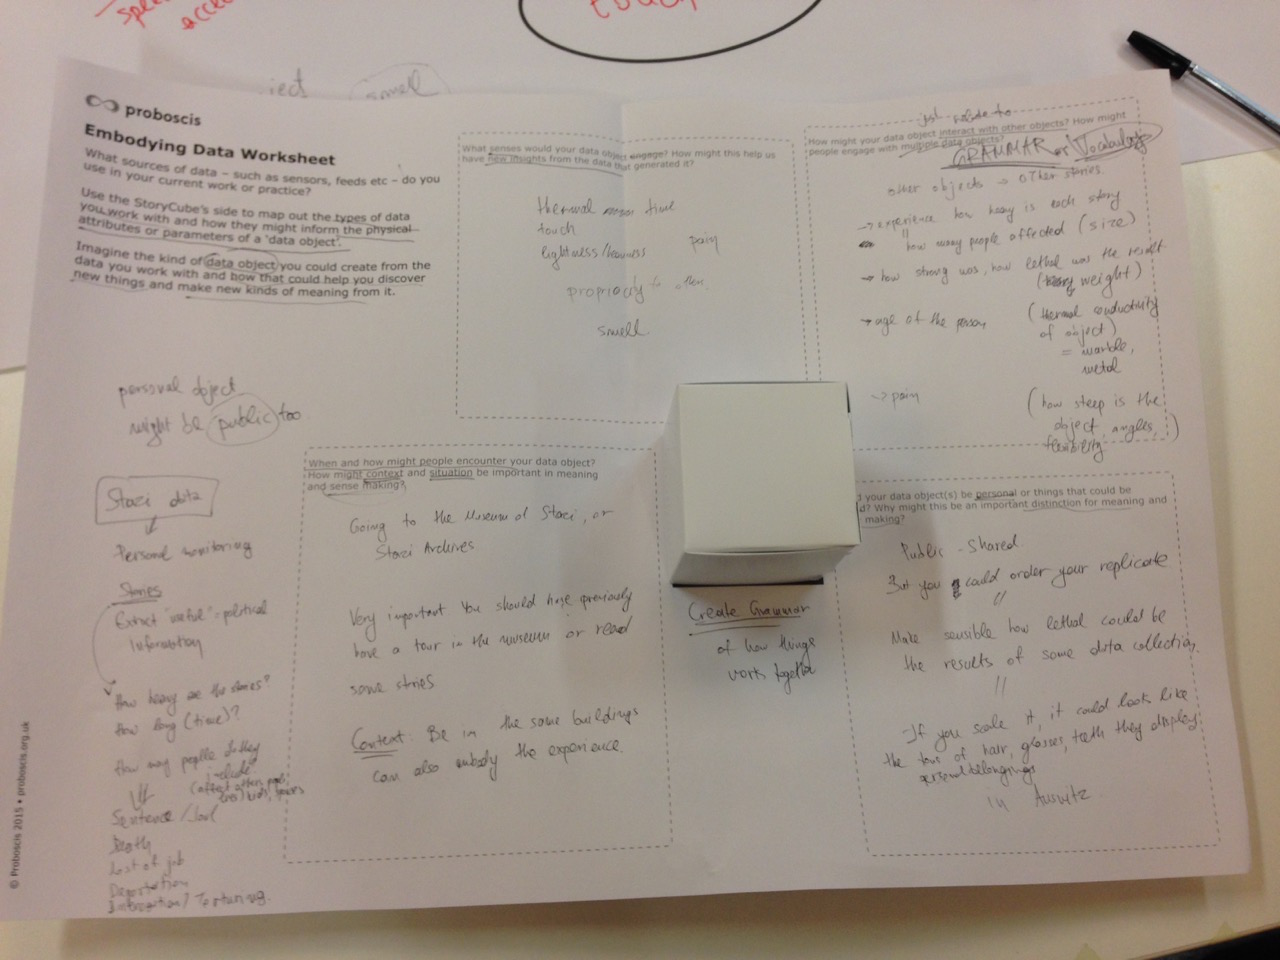
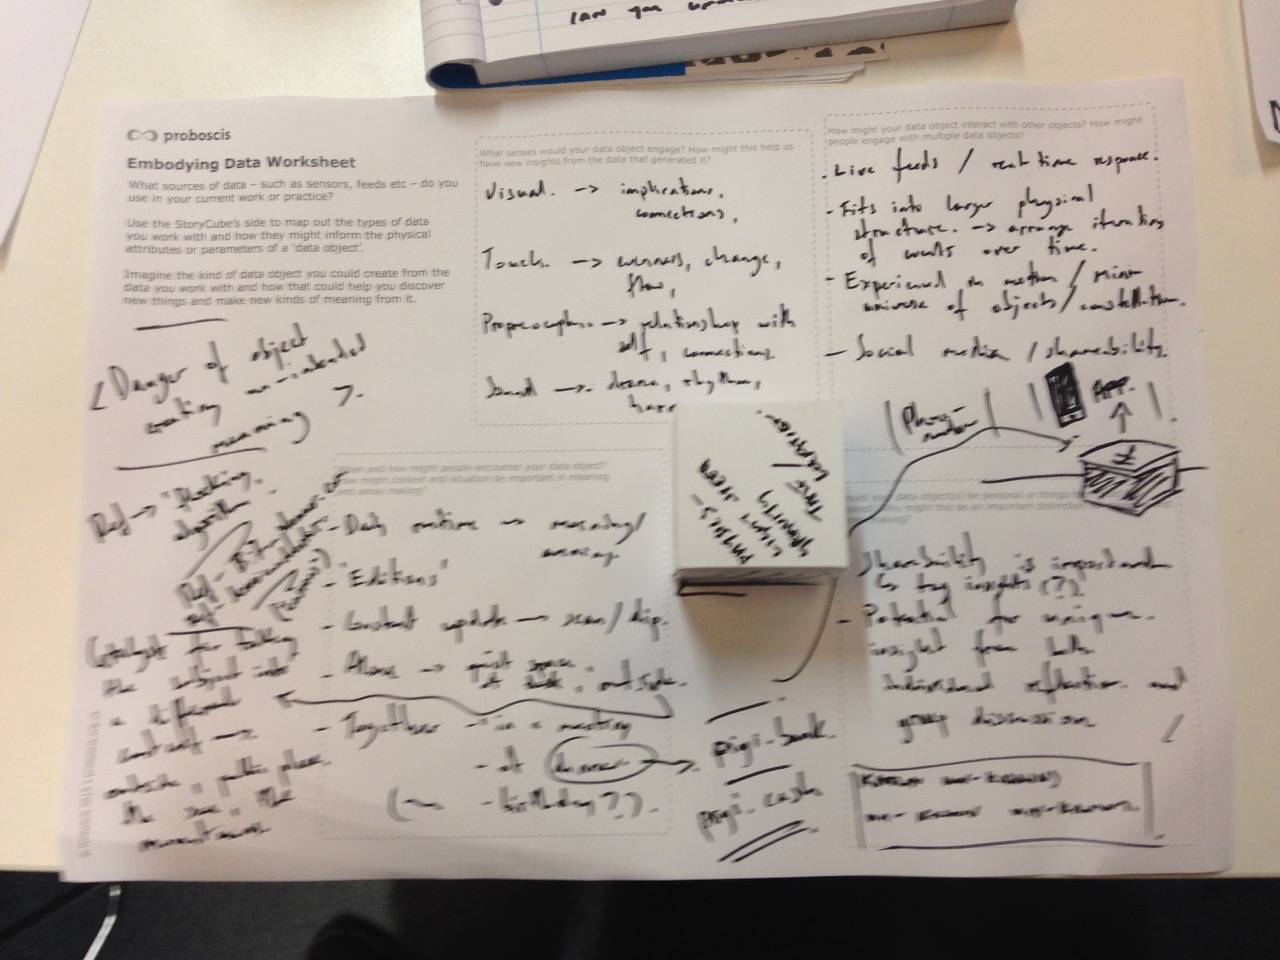
The data manifestation trajectory goes back way further too – to a concept of “tangible souvenirs from digital experiences” which I first formulated during the Urban Tapestries project in 2003. At the time I realised that engaging with people from a diverse set of social, educational, cultural and economic circumstances would need the creation of hybrid forms of communication and expression (both digital and physical) which would allow people to engage and participate in ways they are comfortable with. This concept further evolved over the years into experiments with sound and tactile interfaces (e.g. the “Rumbler” and “Sensographs” of Sensory Threads) as well as paper-based outputs (e.g. automatically generating StoryCubes or DIFFUSION eBooks from digital assets with the bookleteer API).
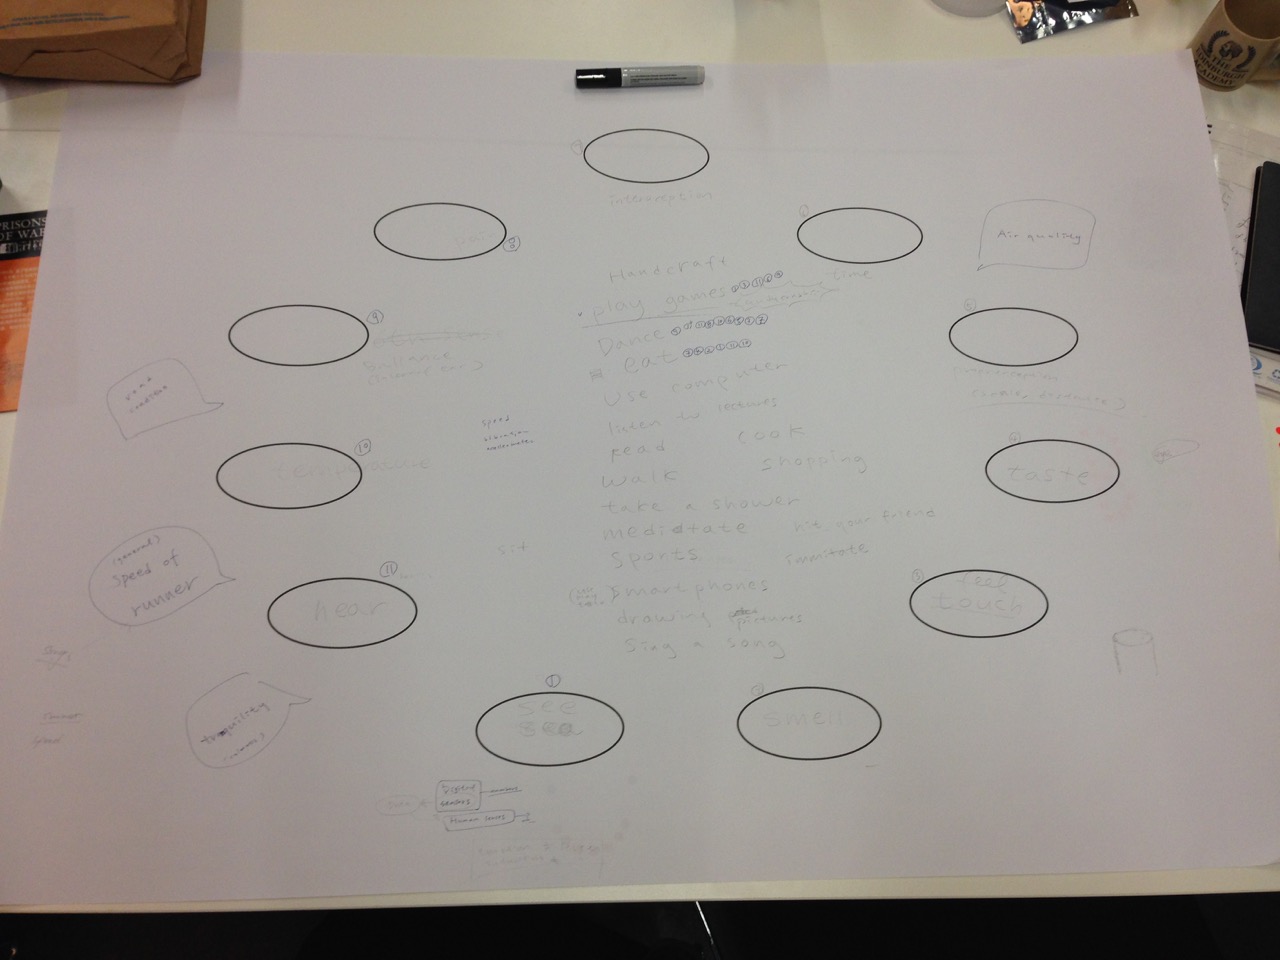
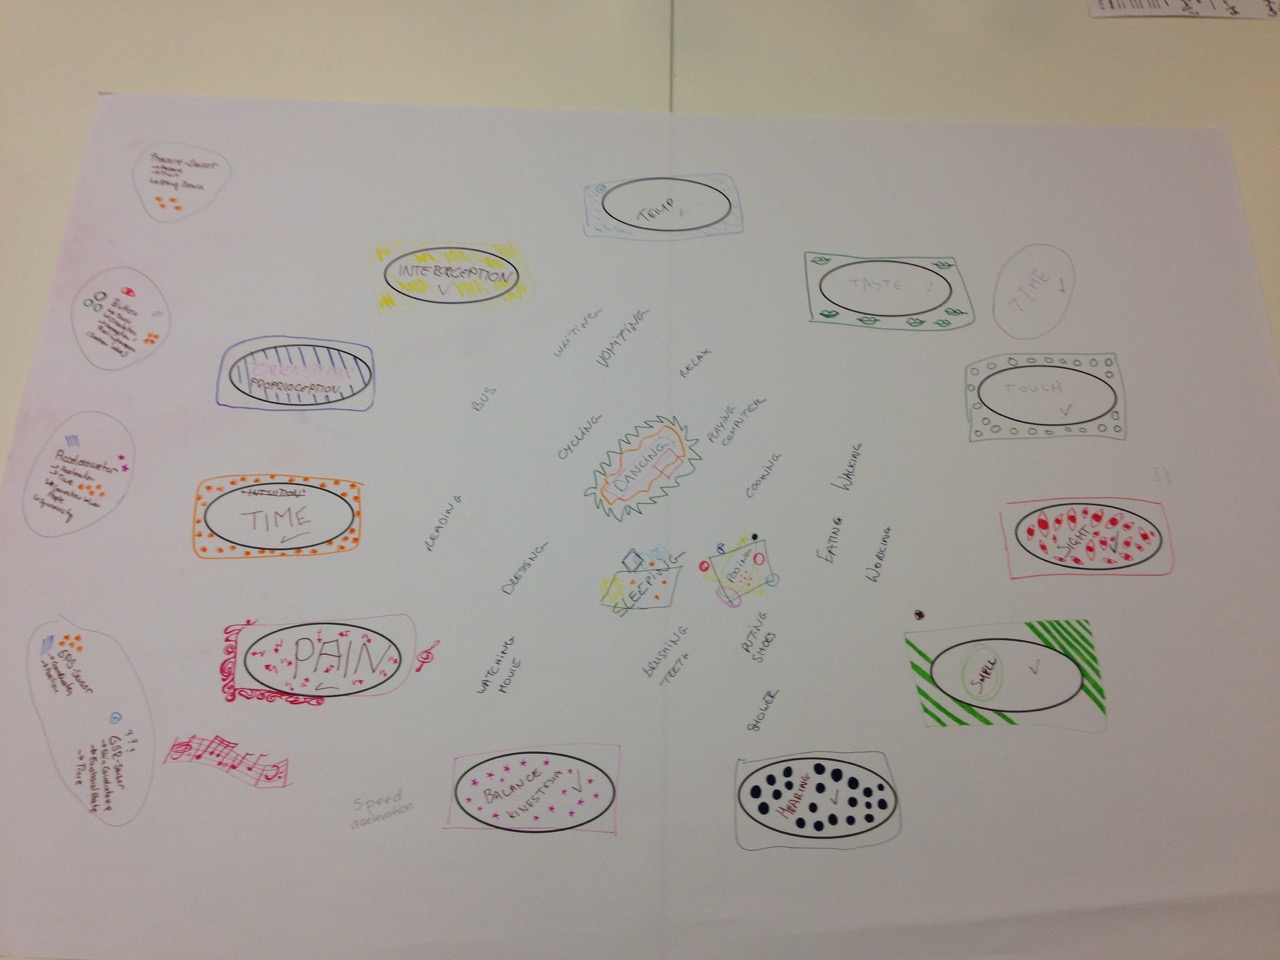
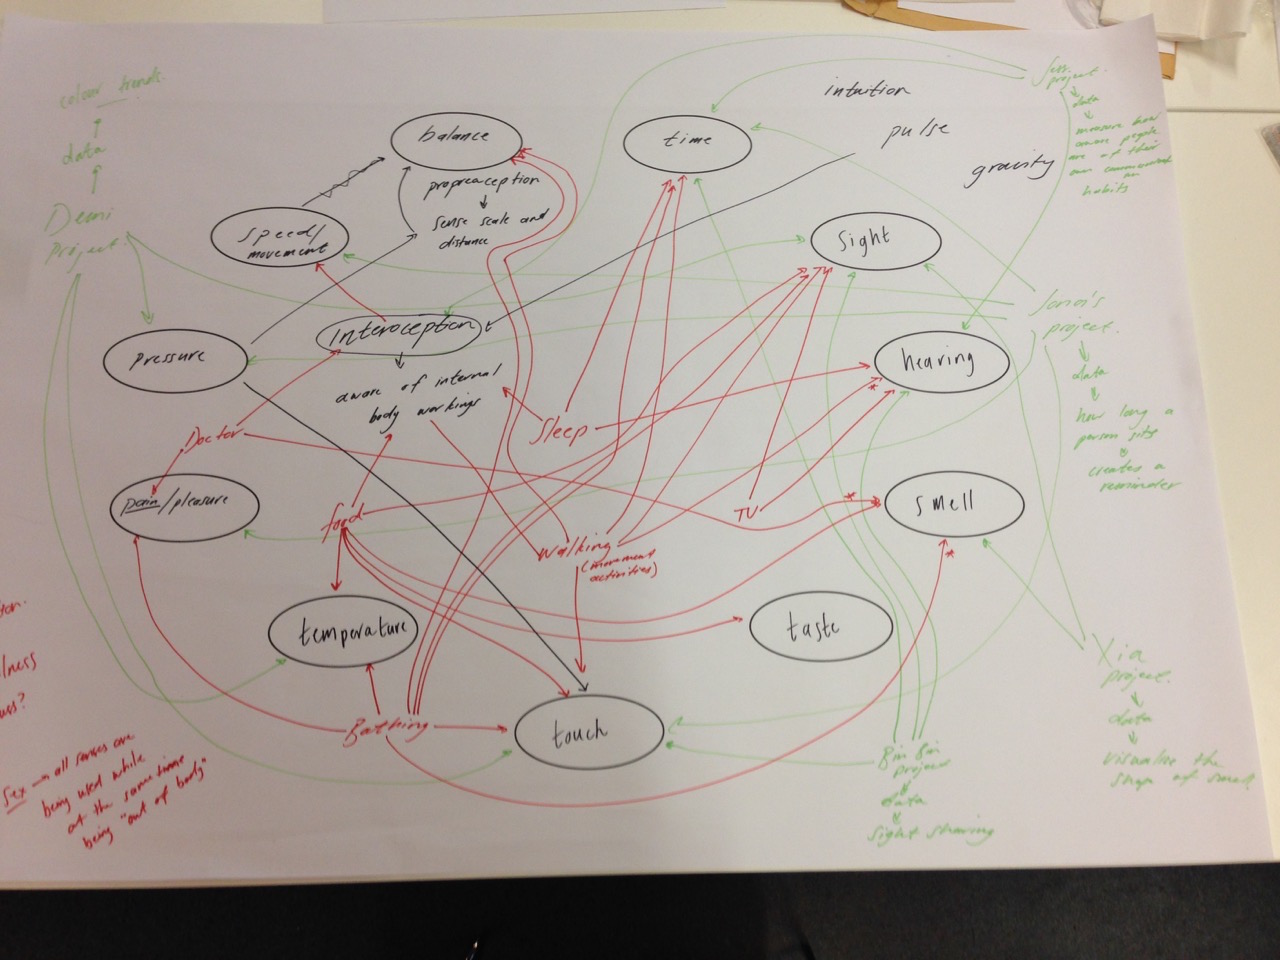
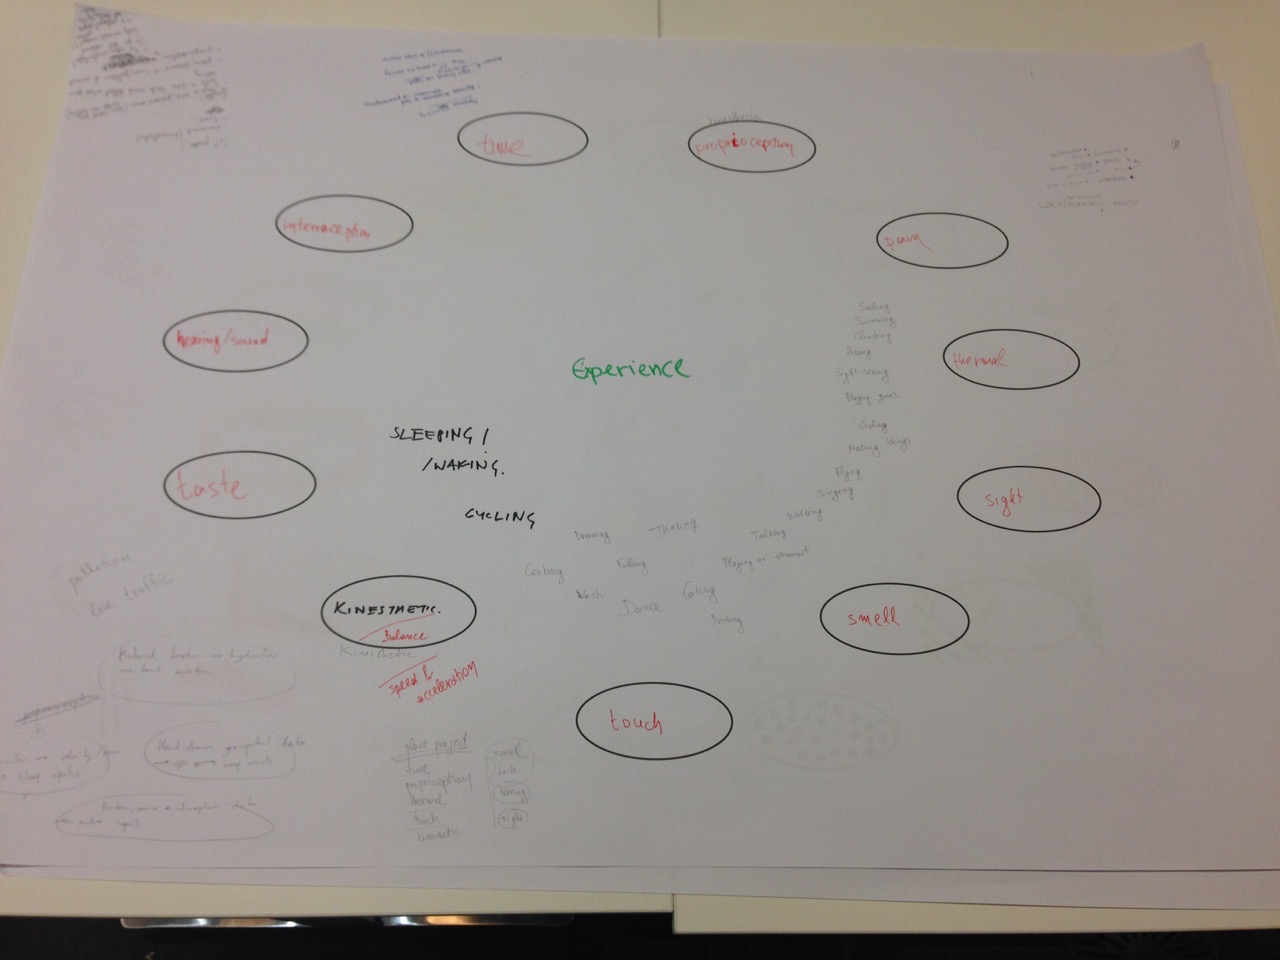
My experiences working with James Leach and the villagers of Reite in Papua New Guinea on our traditional knowledge documentation project, TKRN (2012-20), have also been of crucial importance in extending my thinking and appreciation not just of the extraordinary range of world views that exist (outside the bubble of Western, industrialised culture), but also of the kinds of knowledge that exist. Particularly those that rely on human senses beyond the visual and aural for meaning-making : such as those of touch, smell, taste, proprioception to name a few. An important insight came to me after my first visit to Reite village in 2012, not long after we had generated the initial set of “lifecharms” or data objects for Lifestreams. I wrote about this in two posts in 2013: Tactile Poetry and Digital Alchemy. James’ writing has also been an influence on my thinking, especially his essays Drum and Voice (2002), Leaving the Magic Out (2012) & The Death of a Drum (2015). My experiences in the village have also exposed me to how direct and perceptible climate change is to people who live within nature and the natural world – seasonal weather patterns do not come reliably; plants are not ready to harvest at the usual times; animals, birds and sea creatures are slowly disappearing. All this is increasing year on year, and is the daily reality for people living traditionally in the forest and on the coast.
Back in September 2017 I wrote up many of my ideas and aspirations for melding these different strands of my work in a post – Sensing Climate Change Through Empathic Encounters. Almost a year and a half has passed and it seems a good moment to revisit them in the light of my other activities – including developing the UnBias Fairness Toolkit – at the start of this new juncture. All these projects share my key aim of stimulating agency, trust and reciprocity, themes which I have also written about before (Reciprocities of Trust & Reciprocally Entangled) in different contexts, such as my collaborations with Lizzie Coles-Kemp’s Collective Securities group at Royal Holloway University of London and Marina Jirotka’s Human Centred Computing group at the University of Oxford. And lastly, but certainly not least, my long collaboration with Canadian artist and curator Andrew Hunter (since 2007 through his Render and DodoLab projects) and the creative discussions that have sustained both of us through periods of intensive work and fallow, hard times.
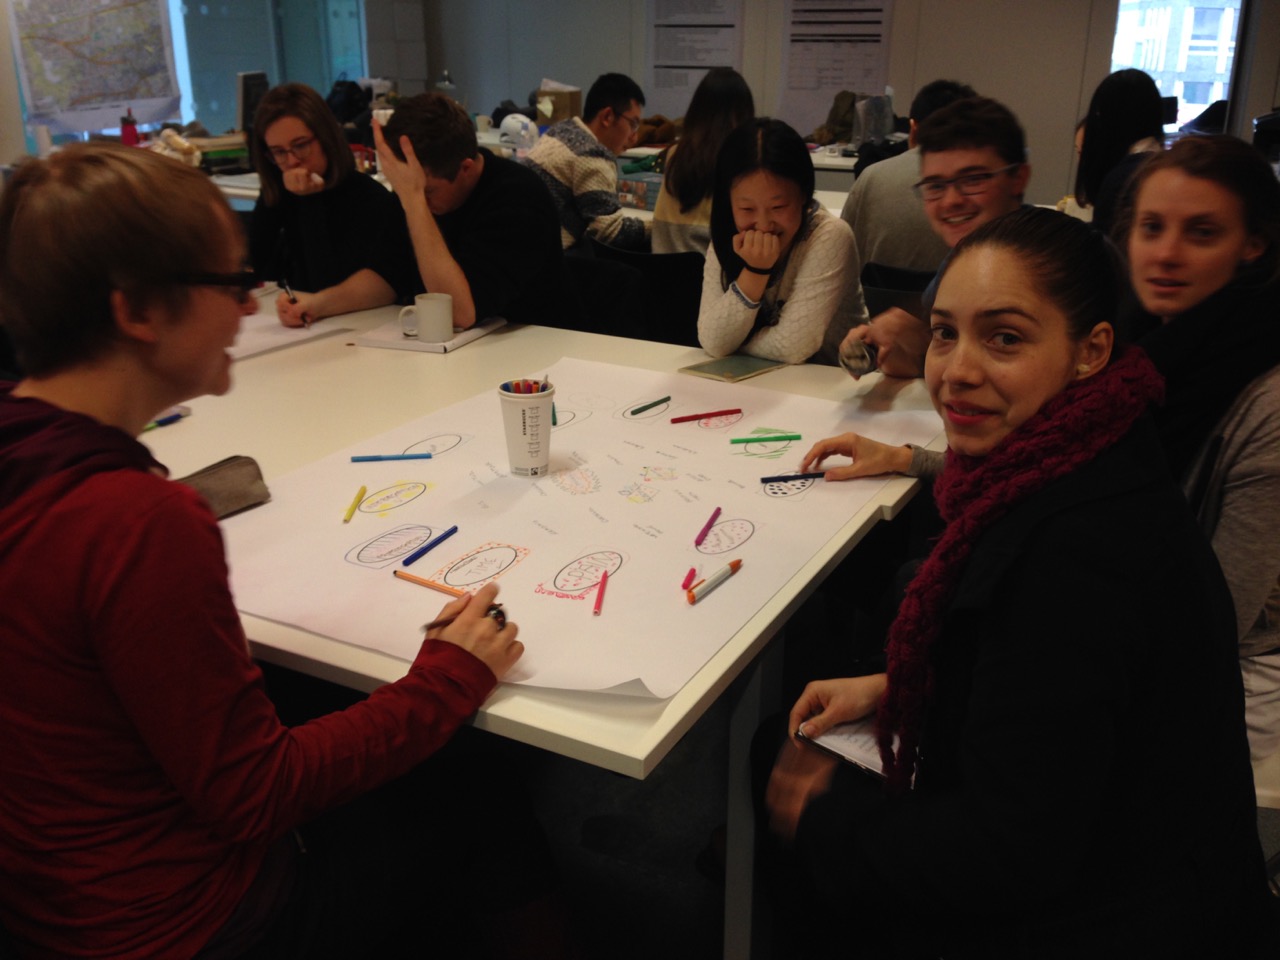
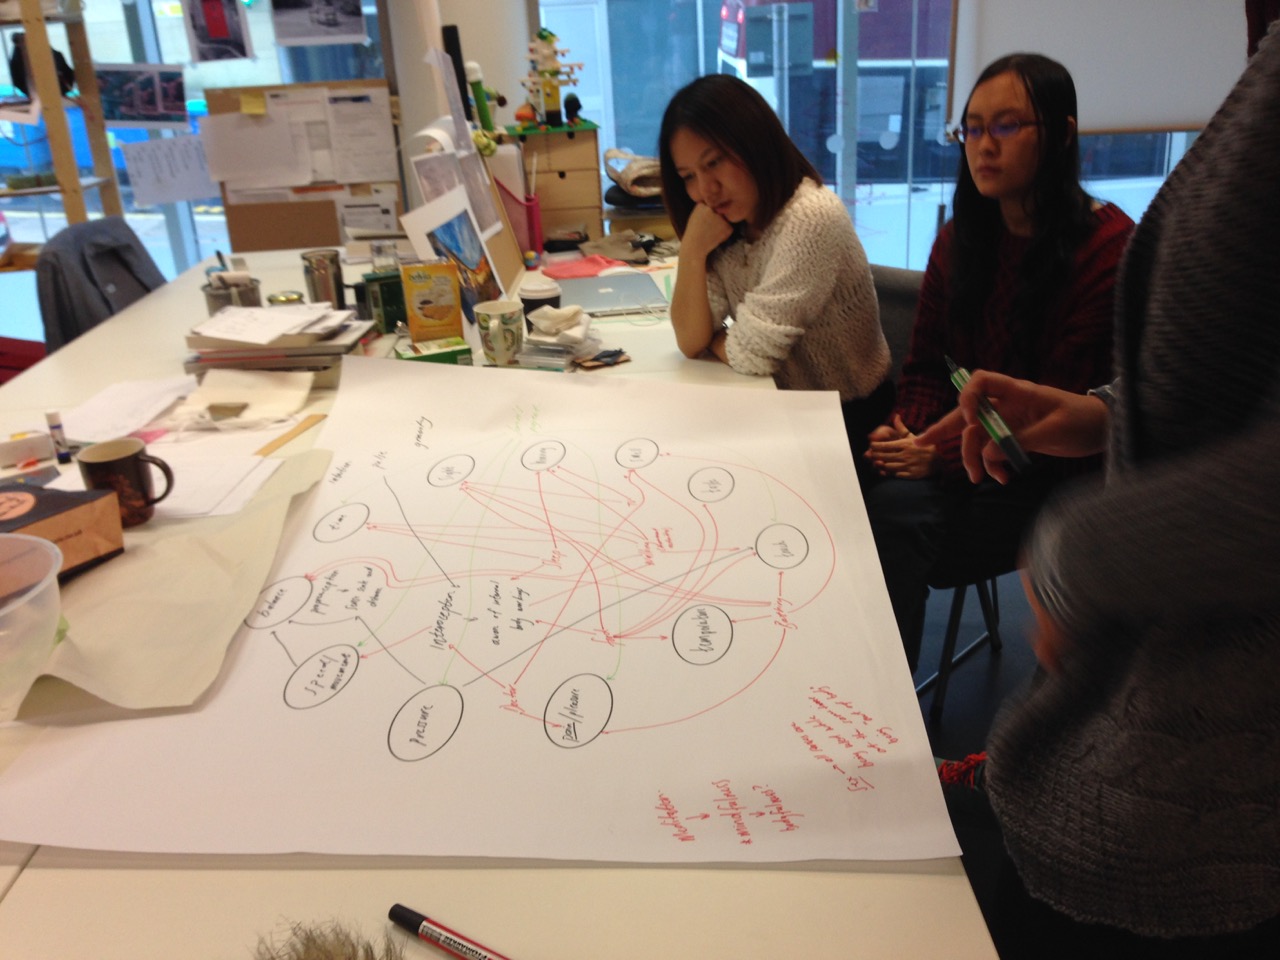
The following sections bring together various threads of my work. This essay is a mélange of ideas in development, weaving together the very new and those which have been delicately spun over a number of years. Something which links across all of them is ‘hiding in plain sight’ – the suggestion that what we seek is often already in front of our eyes, but occluded or hidden from our perception. Sometimes because ‘we cannot see the wood for the trees’, sometimes because an obsession with novelty and innovation blinds us to what already works well. For years I have kept a saying of Charles Eames close to my heart – “Innovate as a last resort” – and a copy of the 1953 Eames India Report close to hand. I recommend watching the wonderful film, Goods, in which Charles Eames gives a talk on the manifest joy to be found in the practical simplicity of everyday things – often overlooked but always within reach of our perception.
Engagement and Occlusion: data-veiling
Three years ago, in March 2016, I was invited to present a provocation at a workshop on ethics and responsible innovation in data science hosted by the Alan Turing Institute. It was an opportunity to demonstrate the ideas behind data manifestation to a large (50+) audience of researchers from a variety of disciplines all concerned with ethics in digital innovation. My Lifestreams colleague, Stefan Kueppers, was by then beginning his PhD with George Roussos at Birkbeck and working as a research assistant on the CloudUDPRS project, devising a mobile app to enable Parkinsons patients to self-monitor their motor tests. As part of the trial, we 3D printed a series of lifecharm shells generated from 4 different patients’ data to demonstrate qualitative differences in the individual experiences of Parkinsons that were masked by scoring similarly on the Unified Parkinsons Disease Rating Scale – which is used to determine care & therapy packages. These were given out to the participants as tangible souvenirs.
My talk provoked a number of interesting conversations about the applicability of data manifestation as a means of communicating information on different levels. There were a number of privacy and cybersecurity experts present with whom I began to speculate on the potential for data manifestation (i.e. expressing data in physical forms) as a novel mode of cybersecurity – especially in the field of medical ethics and patient data. I proposed that encoding patient data in physical forms might be a useful means of allowing data to be transported and ‘shared’ with different people – such as a patient discussing their conditions with a physician. In such a situation both parties can interpret the data object and use it to have an informed conversation because they already understand the context in which the patient’s data was collected and from which the data object has been created. However, and crucially, a third party intercepting the data object would simply be unable to access the source data from which the object was generated (e.g. via reverse engineering) or be able to ascertain its context from the object itself. I refer to this approach as “data veiling” – or hiding in plain sight.
My own experience of helping family members and friends through chronic illness necessitating treatment at different hospitals and clinics, illustrated how often – and insecurely – patient data needs to be shared between multiple parties. Often this means patients having to carry paper records of their data with them to every meeting; sending paper copies by post or emailing unencrypted attachments across the internet. The opportunities for private and extremely personal data to leak out into the wider world are rife, constant and a clear threat to individuals given the intense interest in acquiring private medical data now being shown by the companies at the heart of digital technology and AI/machine learning.
Data-Veiling in this way could be an alternative means to achieve cybersecurity – allowing people to carry a physical expression of their data in a way that prevents the source data being directly accessible – the form itself would be enough for meaning to be discussed. It could allow us to discuss with others what the data implies or means by virtue of establishing tactile grammars that help us interpret the shapes and forms. It would remain secure because is unlikely that the source data could be reverse engineered from the physical form, because the (Lifestreams) method of generating the data object is not parametric but a series of structured mutations. The method flows different data streams together in the generation process which cause variations in the growth shape as they interact with each other. This is also notwithstanding additional variations introduced in the 3D printing process itself, such as surface smoothing and slight reductions in resolution depending on the type of material used to fabricate the object – such as metals, plastic, ceramic etc.
Data-veiling also has echoes with work I’ve been doing in Papua New Guinea (PNG) with indigenous people to document traditional knowledge. In such communities what Westerners think of as knowledge is understood and practiced in very different ways; knowledge is often acquired through complex rituals that make manifest personal status within the community and situate a person within a network of relationships. Having and using knowledge is a demonstration of power and ability. In the West, information generally becomes knowledge through its alienation from context into books and other forms of transactable documentation (such as films, digital files etc) that facilitate universal replicability. This is very different to cultures for whom knowledge seems to reside in how relationships are performed between people, place and things. For instance, there may be specific practices (such as magic or sorcery) which cannot be freely shared or discussed openly. Thus documentation (or expression in some kind of object through design) might serve – sufficiently – as a signpost for those who do have the knowledge; it could indicate the lineage that their knowledge has been acquired through and, how transmission to others might occur (through some form of ritual exchange).
In the village I visit in PNG (when referring to practices and phenomena which Westerners would call magic) people slip from speaking in Tok Pisin (the common national language) into their own local language (Nekgini – spoken by less than a thousand locals) and into ‘hap-tok’ (“half speech”) – a kind of allusive mode of speaking around a subject without discussing it directly. The ability to participate in and understand the meaning behind such discussions would demonstrate either knowledge itself, and the ability to understand how to ‘read’ the signposts being referred to, or to the constraints under which such knowledge could be acquired from those who have it. Porer Nombo, one of the village elders who James has worked with for over two decades, suggested something along these lines when giving a presentation about the ethno-botanical book he co-wrote with James, Reite Plants (as reported in James’ essay, Leaving the Magic Out). To me, this is another kind of hiding in plain sight – documenting part of a story and including clues for the willing to discover how further layers might be accessed. Revealing just enough, sufficient for others to make use of what is spoken.
By encoding sensitive data into physical abstractions it might be possible to conduct informed discussions about the real world meaning of datasets within specific contexts – without having to access or share the data itself all the time. Data veiling could offer a form of signposting or symbolically representing sufficient data without having to reveal its full detail. Shifting our focus from data to the patterns and meanings we can interpret from it.
Reciprocity, Care and Safety
Over the past two and a half years my attention has been largely taken up with my role in the UnBias project, and in particular, devising practical and pragmatic ways to foster both an awareness of bias, trust and fairness in algorithmic systems, and how to “do ethics”. ‘AI Ethics’ went mainstream in 2018 and there is now huge interest in how those companies which build digital technologies and services (especially those involved in AI and machine learning) can deliver responsible innovation through ethical design and development processes.
The egregious harms to democracy, as well as to individuals, which have been exposed in the past few years (Snowden, Cambridge Analytica etc) give this a tremendous urgency. More and more systems and decisions seem to be being automated, with all the damaging effects long-predicted becoming day-to-day reality. Whilst human consciousness is able to deal with contradictory states and can make informed judgements that reflect the complexity of contexts and situations, we are yet to devise machines that can handle such complexity themselves. Perhaps this is an inherent weakness of the binary mathematics they are built on? Increasingly the evidence emerges not only of systemic bias being found in automated systems (mostly trained on inherently biased datasets), but also of how such systems are amplifying pre-existing biases and prejudicial outcomes which have the greatest impact on the most vulnerable in society. I fear that the kinds of automation offered by AI/Machine learning, based essentially on inferences drawn from incomplete and prejudicial datasets, might only ever be a zero-sum game that inevitably leads to a “statistical… regression to the mean” (quoted from Alan Blackwell, below).
The danger is not the creation of systems that become maliciously intelligent, but of systems that are designed to be inhumane through neglect of the individual, social and political consequences of technical decisions.
Alan Blackwell, “Interacting with an Inferred World: The Challenge of Machine Learning for Humane Computer Interaction“
The mainstream narrative for increasing automation has for a long time revolved around “efficiency” – that machines are more efficient than people, they cost less, are somehow ‘neutral’ etc etc. We need to closely interrogate such narratives and expose their fallacy for what it is: a mask to cover the reality of where that vast bulk of the benefits flowing from such automation go. This is hardly a new situation – for hundreds of years people whose ways of life and agency have been undermined and eroded by capital and automation have tried to resist what is essentially a subjugation. Their descendants created unions, cooperatives and formed mutual societies to win back some of their lost agency and initiative, but history shows us it is a recurring theme, for which almost each generation has to find new answers and approaches.
We are also beginning to see the end of another narrative that has specifically woven itself around digital technologies – that innovation should be unfettered by regulation, and that the digital tech industries are creating change faster than laws and regulations can keep up with them. We live in a time where a corporatist agenda seems to have gained a triumphal ascendancy, and where mantras like “information wants to be free” are posed against a picture of a heavy-handed state endlessly creating red-tape to frustrate the innovators and entrepreneurs who are cast as the only ones who create new value in society. Such narratives are as hollow and self-serving as those which reduce all values to the purely monetary and refuse to account for key human values such as kindness, love, generosity, happiness, play, pleasure and joy.
Returning the the theme of hiding in plain sight, I have drawn great inspiration from the work of William Perrin and Lorna Woods on the concept of duty of care in social media regulation for the Carnegie UK Trust. They look back to the groundbreaking UK Health And Safety legislation of 1974 which harmonised protections for workers across all industries and workplaces under a general duty of care, and extended those duties to pro-active harm anticipation and reduction through due diligence to the rest of society. Their suggestion is to build a new regulatory framework which draws upon the well-established principles of Health and Safety legislation to create a proactive duty of care on providers of digital services and platforms for harm reduction. This would shift the emphasis from the current post hoc situation where liability is assessed and punished only after harm has been experienced, to an a priori approach based on taking care as a first principle. A fundamentally diametric approach to the infamous Silicon Valley mantra of “move fast and break things”. Digital Safety rather than Digital Security – proactive efforts that care for rather than seek redress for harms already done.
What I like so much about this approach is that it builds trust based on reciprocity – when we know that people are exercising a duty of care on all our behalfs, we trust that they will do their best to not harm others. Trust is both formed through, and builds on, relationships and the performance of the values that underpin them, not simply through transactions. For this reason I remain highly skeptical of the utopian claims for ‘smart contracts‘ that have surrounded the blockchain hype in recent years. Whilst they may offer some benefits in terms of automating certain types of exchange, I see specific dangers in attempting to reduce all kinds of complex relationships and exchanges to contractual standards based on transactions. What of trust? What of reciprocal obligations and fundamental rights? There is always a tension between human rights and contract law – an asymmetry where the weaker party is often induced to sign away their rights for incommensurate benefits to the advantage of the stronger party. Unless we have robust institutions and frameworks for the protection of the vulnerable, and people have access to education and information about their rights and values, we will forever be at the mercy of those who corral power and wealth for themselves, and seek to buy their way out of obligations to others through unbalanced contracts and negotiating power.
Who gains from a world where we are increasingly encompassed by contracts that privilege transactional relationships? In which social domain are such contracts disputed and settled? Traditionally lawyers and those who can afford to be litigious have been the gatekeepers and prime movers in contractual situations. Smart contracts may seek to subvert this nexus, but will they really democratise these processes or simply alter the landscape of who holds the upper hand in favour of the programmers – and their employers – who are able to understand and manipulate the arcane new languages that evolve with them?
It seems to me that human rights and concepts like duty of care and the precautionary principle are a critical baseline that are collective in nature – i.e they support everyone in society regardless of status or situation. In contrast to this are contracts and transactional systems which inevitably privilege negotiations for those already invested with power and resources. If we truly want a fair and just society, supported by tools and technologies that we trust, then it seems to me that we must reinvigorate constitutional democracy with transparent rights and laws, as well as accessible education and information about what they mean and how they affect people. That way we can take care of each other.
Inspiring and Stimulating Others
Despite the focus of my new project on climate change, I’ve barely touched on it here and it is, to my mind, the most critical issue we face as a species living in a fragile ecology. My preoccupation with agency is, though, at the very heart of how I think we can inspire and stimulate the kinds of societal change necessary to preserve as much of life on earth as we can. I am neither an ecologist nor a climate activist, but I believe that each person must find within their own skillset and area of work and life the means to contribute positively to such change. Not just in terms of our personal habits of consumption, but in the effect that our work can have on others and the processes we live within. As an artist and designer, I feel it is my duty to achieve this the best way I can – by inspiring others and, ideally, stimulating them to be hopeful and to take agency for themselves.
I have also been inspired by coming across a remarkable initiative that took place in the UK in the 1970s – the Lucas Plan. Faced with the threat of massive redundancies the shop stewards of several unions representing workers at Lucas Aerospace formed a ‘Combine’ to develop an alternative business and industrial plan for the company. This was based on producing ‘socially useful products’ (at the time 50% of Lucas’ products were parts for military hardware) and around 150 such products were proposed by the workers, based on existing skills, tooling and capabilities. Ultimately they were dismissed by the management board. Never-the-less, the initiative inspired many other outcomes and initiatives – some of which continue to this day. (Incidentally, many of the then experimental products are now mainstream). Watch a trailer for Steve Sprung’s forthcoming documentary, The Plan, or an original 1978 documentary by the Open University/BBC. To me this is an example of what happens when people begin to take agency for themselves and reimagine some of the basic premises about what it means to be responsible for their actions – for the things they produce as a worker in a firm or institution, for the impact this has on society and the environment. With this sort of thinking and action we might yet reconfigure our society and industry towards a trajectory that minimises the impact on the ecosystem and life in general, and mitigates some of the worst excesses of the past for a sustainable future.
One of the key figures in the Combine was Mike Cooley, whose 1980 book, Architect or Bee? The Human Price of Technology, sets out a clear vision for human-centred, socially useful design and production. His thoughts on ‘augmented and symbiotic systems’ in favour of automation or classical AI systems are particularly brilliant. He proposes that such technologies be created to enhance human capabilities, not replace them. He describes the path to expertise as being one which increasingly expands on the basic rules acquired along the learning journey adding intuition, insight and imagination as one’s experience grows. The goal he suggests is for technologies to enable and augment everyone’s capacities, not to de-skill people merely to increase the profit share for managers and owners. He calls for humane technologies that not only increase our abilities to make things, but to appreciate life, freedom and choice as well. In one example, Cooley writes of designing expert medical systems in the 1980s which,
“provide an interaction between the ‘facts of the domain’ and the fuzzy reasoning, tacit knowledge, imagination and heuristics of the expert, and no attempt is made to reduce all these aspects to a rule-based system – the system is seen as something that aids rather than replaces the expert.”
Although not long, the scope of this book is vast and is full of insights into the operation of power in society, politics, business and industry as well as offering practical suggestions for how to address it creatively and with intelligence. It is a vision for empowering people to act for mutual benefit, in sympathy with the ecosystem which sustains us. As we grapple with the choices ahead of us for democracy and ecological sustainability, we could do worse than take a few leaves from this book:
“The choices are essentially political and ideological rather than technological. As we design technological systems, we are in fact designing a set of social relationships, and as we question those social relationships and attempt to design systems differently, we are then beginning to challenge, in a fundamental way, power structures in society.”
My hope for the Materialising Data project is that we can find new ways to create empathic encounters with the urgent, complex reality of climate change for people to whom it is not yet as directly appreciable as it is for those living closer to nature. In challenging the dominant modes and forms of how we make meaning from data, I hope that we too can begin to challenge some of the power structures in society that have remained inert in the face of growing emergency for almost my whole lifetime. We have a duty of care for future generations, and for all the other forms of life we share this planet with. The answers remain before us, hiding in plain sight – we just have to be brave enough to adopt them.
Despair is not an option:
Anticipate the worst;
Hope for the best;
Cope with what comes;
Tread lightly on the earth.
London, February 2019


You must be logged in to post a comment.